RSI Crypto: How the Relative Strength Index Moves Crypto Prices
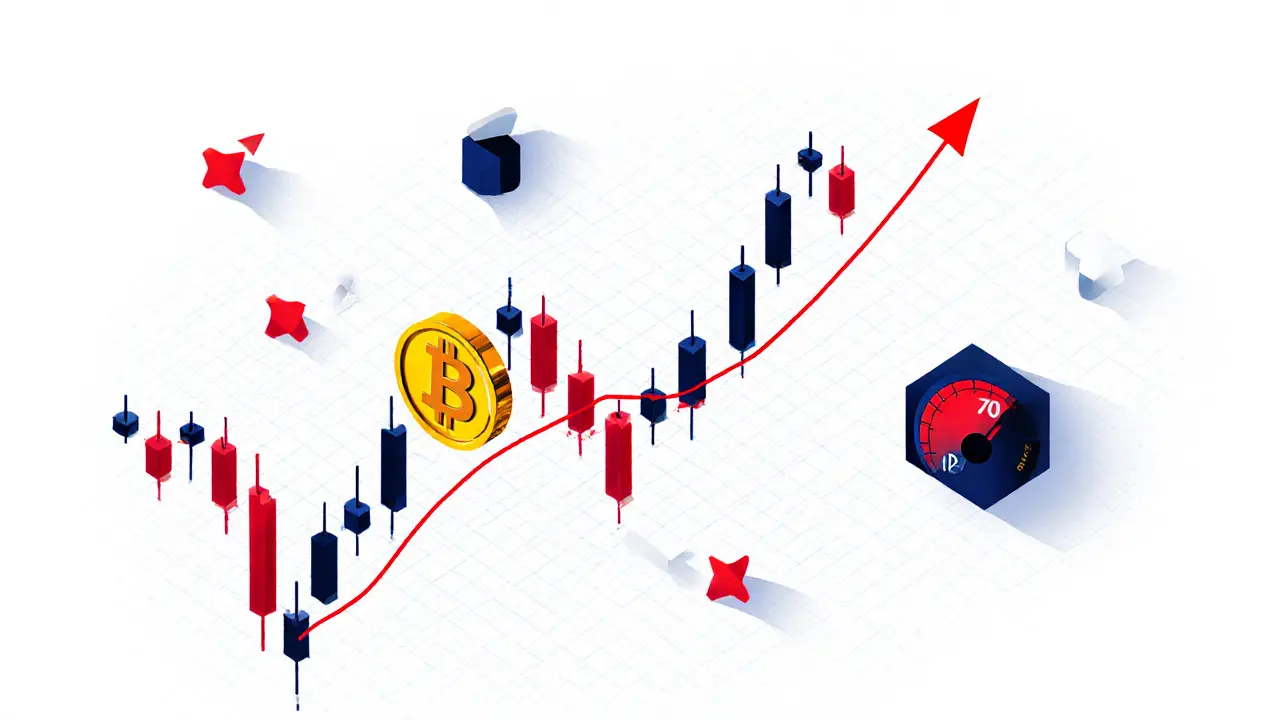
When you see a crypto price shoot up fast, it’s not magic—it’s often RSI crypto, a momentum oscillator that measures the speed and change of price movements to show if an asset is overbought or oversold. Also known as the Relative Strength Index, it’s one of the most used tools in crypto trading because it cuts through the noise and tells you when a move might be about to reverse. Unlike simple price charts, RSI gives you a number—usually between 0 and 100—that shows how strong the buying or selling pressure is right now. If it hits 70 or above, the market might be overbought. If it drops below 30, it could be oversold. That’s not a buy or sell signal by itself, but it’s a red flag that tells you to look closer.
Traders don’t use RSI alone. They pair it with volume, moving averages, or even news events. For example, if Bitcoin’s RSI hits 80 but trading volume is dropping, that’s a sign the rally is losing steam—even if the price keeps climbing. On the flip side, if Ethereum’s RSI drops to 25 while more people are buying, it could mean the dip is a real opportunity. The real power of RSI crypto isn’t in the number, it’s in the context. It helps you spot when hype is out of sync with actual buying behavior. That’s why so many posts here focus on RSI alongside real trading data, exchange trends, and market sentiment.
You’ll find posts here that show how RSI played out during wild crypto swings—like when Solana tokens surged past RSI 80 only to crash 40% in days, or how traders used RSI divergence to exit before the 2022 bear market hit. Some of these posts even compare RSI with other indicators like MACD or Stochastic, so you know which one works best in different market conditions. You won’t find fluff here—just real examples from live crypto markets where RSI actually changed decisions. Whether you’re new to trading or you’ve been watching charts for years, understanding how RSI behaves in crypto—where volatility is normal and sentiment shifts fast—isn’t optional. It’s the difference between guessing and knowing.
What Is Technical Analysis for Cryptocurrency? A Practical Guide for Traders
Technical analysis for cryptocurrency uses price charts and indicators to predict market movements. Learn how support/resistance, moving averages, RSI, and candlesticks help traders make decisions - and why combining them with volume and on-chain data is key.
learn more