Technical analysis for cryptocurrency isn’t magic. It doesn’t predict the future with certainty. But if you’ve ever looked at a Bitcoin chart and wondered, “Is this the bottom?” or “Should I sell now or wait?” - then you’re already thinking like someone who uses technical analysis. It’s the practice of reading price charts and trading volume to guess where the market might go next. And in crypto, where prices swing wildly based on tweets, regulations, or whale movements, it’s one of the few tools traders can actually use to make sense of the chaos.
How Technical Analysis Works in Crypto
At its core, technical analysis for cryptocurrency is built on three simple ideas:- Price reflects everything - news, fear, hype, adoption - all of it is already priced in.
- Prices move in trends - up, down, or sideways - and those trends tend to keep going until something forces them to reverse.
- History repeats itself - because humans are still the same. Fear and greed haven’t changed since the 1800s, and they drive crypto markets just like they drive stocks.
Key Tools Every Crypto Trader Uses
You don’t need to know every indicator. But if you’re serious about trading crypto, you need to understand these five:Support and Resistance Levels
These are price zones where buying or selling has historically stopped the market. Think of them like floors and ceilings.- Support: A price level where buyers step in and push the price back up. If Bitcoin keeps bouncing off $60,000, that’s support.
- Resistance: A price level where sellers step in and push the price back down. If Ethereum keeps failing to break $3,500, that’s resistance.
Moving Averages (50-day and 200-day)
These smooth out price data to show the overall trend. The 50-day moving average shows the short-term trend. The 200-day shows the long-term trend. When the 50-day crosses above the 200-day, it’s called a Golden Cross. Historically, this has signaled the start of a strong bull run. In Bitcoin’s 2024 rally, this pattern preceded a 78% price increase in the following 90 days, according to CoinGlass data. When the 50-day crosses below the 200-day, it’s a Death Cross - often a warning sign of a major downturn.Relative Strength Index (RSI)
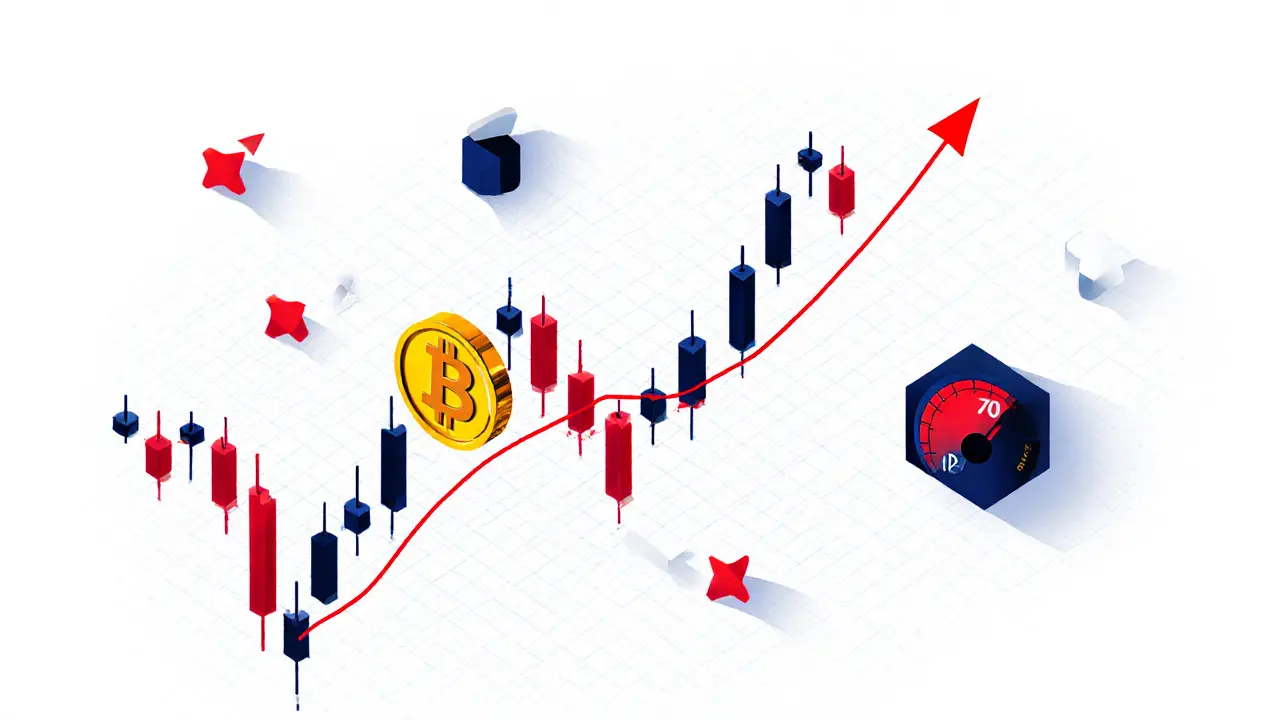
This measures how fast a price is moving. It runs from 0 to 100.- RSI above 70 = overbought (might be due for a pullback)
- RSI below 30 = oversold (might be due for a bounce)
Bollinger Bands
These are two lines that wrap around a moving average. They expand when volatility increases and shrink when it drops.- Price touching the upper band = strong upward momentum
- Price touching the lower band = strong downward momentum
- Band contraction = quiet market - often followed by a big breakout
Candlestick Patterns
Each candle tells a story. A long green candle means buyers dominated. A long red candle means sellers took over. Some patterns are famous:- Hammer: Small body, long lower wick - suggests buyers stepped in after a drop.
- Shooting Star: Small body, long upper wick - sellers pushed price down after a rally.
- Doji: Tiny body, equal wicks - indecision. Market might be about to change direction.
What Works - and What Doesn’t
Technical analysis shines in short-term trading. If you’re holding for days or weeks, it’s incredibly useful. But it fails when big news hits. In September 2021, China banned crypto trading. Bitcoin dropped 30% in 24 hours. All the bullish patterns, moving averages, and RSI readings? Irrelevant. The market reacted to a regulatory shock - something technical analysis can’t predict. That’s why the best traders don’t rely on one tool. They combine technical analysis with on-chain data - like exchange net outflows or wallet activity. According to Delphi Digital’s 2025 report, traders who use RSI divergences and rising exchange outflows have a 73% success rate in spotting reversals. On the flip side, using too many indicators kills profits. A CryptoQuant study found that traders using five or more indicators on one chart had 34% lower returns than those using just one or two. Overcomplicating leads to analysis paralysis.How to Start - No Experience Needed
You don’t need a finance degree. You don’t need to pay for software. Here’s how to begin:- Go to TradingView (free tier works fine).
- Search for Bitcoin or Ethereum.
- Apply these three indicators: 50-day MA, 200-day MA, and RSI.
- Look at the weekly chart first. What’s the trend? Up? Down?
- Then check the daily chart. Are prices near support or resistance?
- Only look at 4-hour or lower charts if you’re planning a trade - not for strategy.
The Big Debate: Is It Real?
Some experts swear by it. Dr. Alexander Elder, a legendary trader, says crypto is actually better for technical analysis than stocks because it’s driven purely by emotion - not corporate earnings or balance sheets. Fear and greed create clearer, more predictable patterns. Others call it nonsense. Dr. Nouriel Roubini, the economist known as “Dr. Doom,” calls technical analysis in crypto “astrology.” He argues that since crypto has no intrinsic value, past price patterns mean nothing. The truth? It’s somewhere in between. Technical analysis works best when:- You’re trading on timeframes longer than 5 minutes.
- You combine it with volume and trend confirmation.
- You accept that it’s a probability game - not a crystal ball.

What’s Changing in 2025
The tools are getting smarter. Platforms like TrendSpider now use AI to automatically spot chart patterns - like head and shoulders or cup and handle - with 89% accuracy, according to their Q1 2025 whitepaper. TradingView launched crypto-specific indicators in early 2025: funding rate heatmaps, perpetual futures open interest, and liquidation clusters. These help traders see where the crowd is trapped - and where big moves might start. Kraken and Coinbase now let you overlay on-chain data - like NUPL (Net Unrealized Profit/Loss) - directly on your charts. This lets you see if holders are in profit or panic - and whether a breakout is backed by real conviction. The future isn’t about replacing technical analysis. It’s about combining it with data from the blockchain itself. The most successful traders today don’t choose between TA and on-chain metrics. They use both.Common Mistakes to Avoid
Even experienced traders mess up. Here are the top errors:- Trading on too small a timeframe - 1-minute or 5-minute charts are noise. Use daily or weekly to find the trend.
- Chasing every indicator - 5 indicators don’t mean 5x better signals. They mean 5x confusion.
- Ignoring volume - A breakout without volume is fake. Always check if volume is rising with price.
- Forgetting risk management - No indicator saves you from blowing up your account. Always set stop-losses.
- Trading news events - If the SEC announces a new rule, or Elon tweets - pause. Technical analysis doesn’t work during chaos.
Final Thought: It’s a Tool, Not a Crutch
Technical analysis for cryptocurrency won’t make you rich overnight. But if you learn to read charts, respect risk, and combine it with other data - you’ll have a real advantage over 90% of retail traders who guess based on memes. It’s not about predicting the future. It’s about understanding the present - and positioning yourself where the odds are in your favor.Is technical analysis reliable for crypto trading?
Yes - but only if used correctly. Technical analysis works best in trending markets and over timeframes longer than one hour. It’s less reliable during major news events like regulatory bans or exchange collapses. Success comes from combining multiple indicators and confirming signals with volume. Backtested data shows that when three indicators align (like RSI, moving averages, and support/resistance), the success rate jumps to over 80%.
Do I need to pay for tools to do technical analysis?
No. Most major exchanges like Binance, Coinbase Pro, and Kraken offer free charting tools with basic indicators. TradingView’s free plan includes 50+ indicators, multiple timeframes, and drawing tools - enough for beginners. Paid plans ($14.95/month) unlock advanced features like alerts and custom scripts, but you don’t need them to start.
Can technical analysis predict Bitcoin’s next price?
No - and no one can. Technical analysis gives you probabilities, not certainties. It shows you where price has reacted before and where it might react again. For example, if Bitcoin has bounced off $60,000 three times, there’s a higher chance it will do so again. But if a major exchange collapses or a new regulation drops, all patterns can vanish overnight. Use it to manage risk, not to predict the future.
What’s the best indicator for crypto trading?
There’s no single “best” indicator. The 200-day moving average is the most widely used, followed by RSI and Bollinger Bands. But the most effective traders combine them. For example, a buy signal becomes stronger when price breaks above the 200-day MA, RSI is above 50 and rising, and volume increases. The key is confirmation - not one signal, but three working together.
How long does it take to learn technical analysis?
Most beginners take 3 to 6 months to become consistently profitable. The first 4-6 weeks should focus on learning candlestick patterns, support/resistance, and moving averages. After that, practice on historical charts - don’t trade real money until you’ve tested your strategy on at least 20 past trades. Patience beats speed in crypto.
Should I use technical analysis if I’m a long-term HODLer?
Not really. If you’re holding crypto for years, your focus should be on fundamentals: adoption, team, technology, and network growth. Technical analysis is designed for timing entries and exits in shorter timeframes. Long-term investors benefit more from dollar-cost averaging and ignoring short-term noise. Only use TA if you’re planning to rebalance or take profits at certain levels.

Lawrence rajini
October 28, 2025 AT 16:35Matt Zara
October 29, 2025 AT 01:33Jean Manel
October 30, 2025 AT 10:30William P. Barrett
November 1, 2025 AT 03:25Cory Munoz
November 2, 2025 AT 04:34Jasmine Neo
November 3, 2025 AT 16:18Ron Murphy
November 5, 2025 AT 12:07Prateek Kumar Mondal
November 6, 2025 AT 13:56Nick Cooney
November 7, 2025 AT 22:58Clarice Coelho Marlière Arruda
November 8, 2025 AT 02:59Brian Collett
November 9, 2025 AT 15:39Allison Andrews
November 10, 2025 AT 19:04Wayne Overton
November 11, 2025 AT 17:30