Moving Averages Crypto: How Traders Use Them to Spot Trends and Avoid Losses
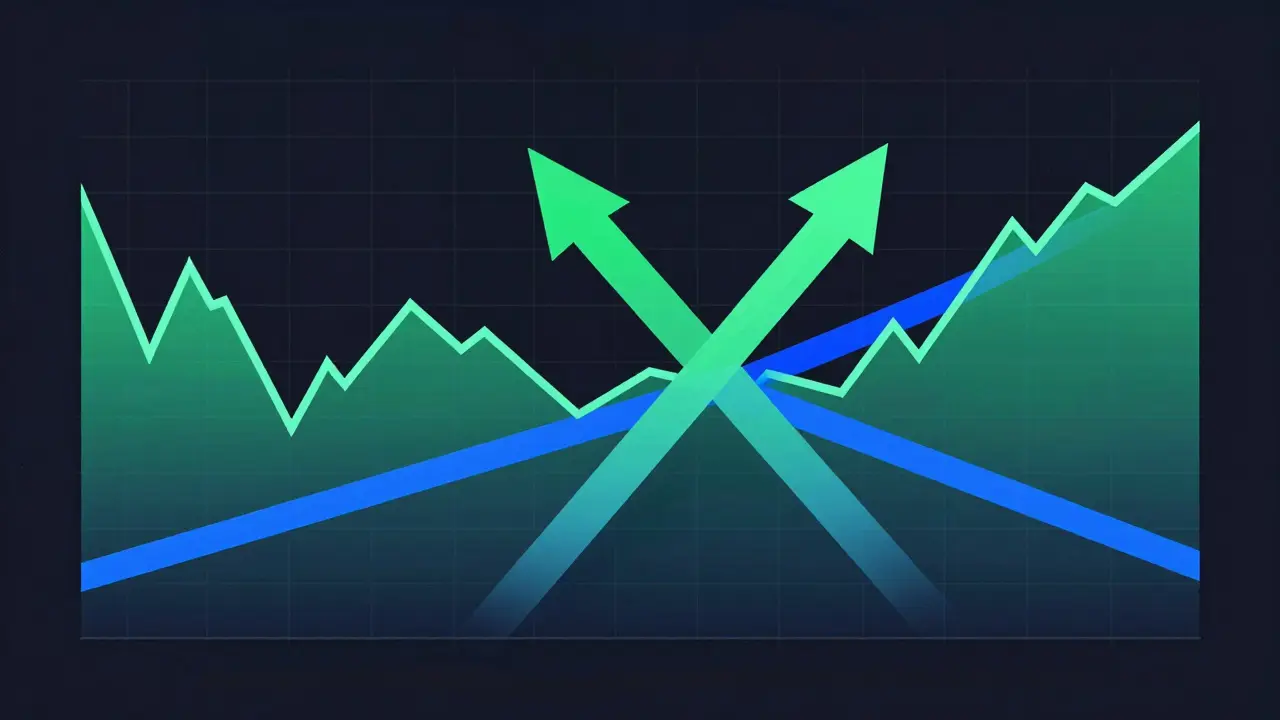
When you hear moving averages crypto, a basic technical tool that smooths out price data over time to show direction. Also known as MA, it's one of the oldest and most trusted indicators in crypto trading—used not by Wall Street elites, but by everyday traders checking their phones between jobs. It doesn’t predict the future. It doesn’t guarantee profits. But it tells you if the market is going up, down, or stuck—and that’s more than most tools do.
There are two main types you’ll see: SMA, the simple moving average, which gives equal weight to every price point in the period, and EMA, the exponential moving average, which weights recent prices heavier. Most crypto traders use EMA because Bitcoin and altcoins move fast. A 50-day EMA crossing above a 200-day EMA? That’s the "Golden Cross"—a signal many watch like a weather forecast. A drop below? The "Death Cross"—a red flag that makes people hit sell buttons.
People don’t use moving averages alone. They pair them with volume, RSI, or support levels. You’ll see traders on Twitter bragging about their 12-day EMA strategy, but the real pros use multiple timeframes: check the 4-hour chart for entry, then confirm with the daily. And no, a 15-minute moving average crossover isn’t a trading edge—it’s noise. Real traders look for patterns that hold across days, not minutes.
What you won’t find in the posts below are fake "100% win rate" moving average bots. Instead, you’ll see real examples: how BlueBit traders use EMA with MT5, how Superp users track momentum on BNB Chain, and how traders avoid scams like NUT MONEY or Tsunami.cash by watching price action, not hype. You’ll also see why some tokens—like Global Token (GBL) or AXL INU—have zero moving average structure because there’s no real trading behind them. Moving averages only work when there’s actual market activity.
If you’re new to crypto, start with the 50 and 200-day averages on Bitcoin. Watch how price reacts when it touches them. Notice when it bounces. Notice when it breaks through. That’s your education. No indicators, no signals, no bots—just price and time. The posts here don’t sell you magic formulas. They show you what works, what’s broken, and what’s outright fake. And that’s the only edge you need.
Moving Averages in Crypto Technical Analysis: How Traders Use SMAs and EMAs to Spot Trends
Moving averages help crypto traders cut through market noise by smoothing price data. Learn how SMAs and EMAs identify trends, support levels, and key signals like the Golden Cross-and why they remain essential despite crypto's volatility.
learn more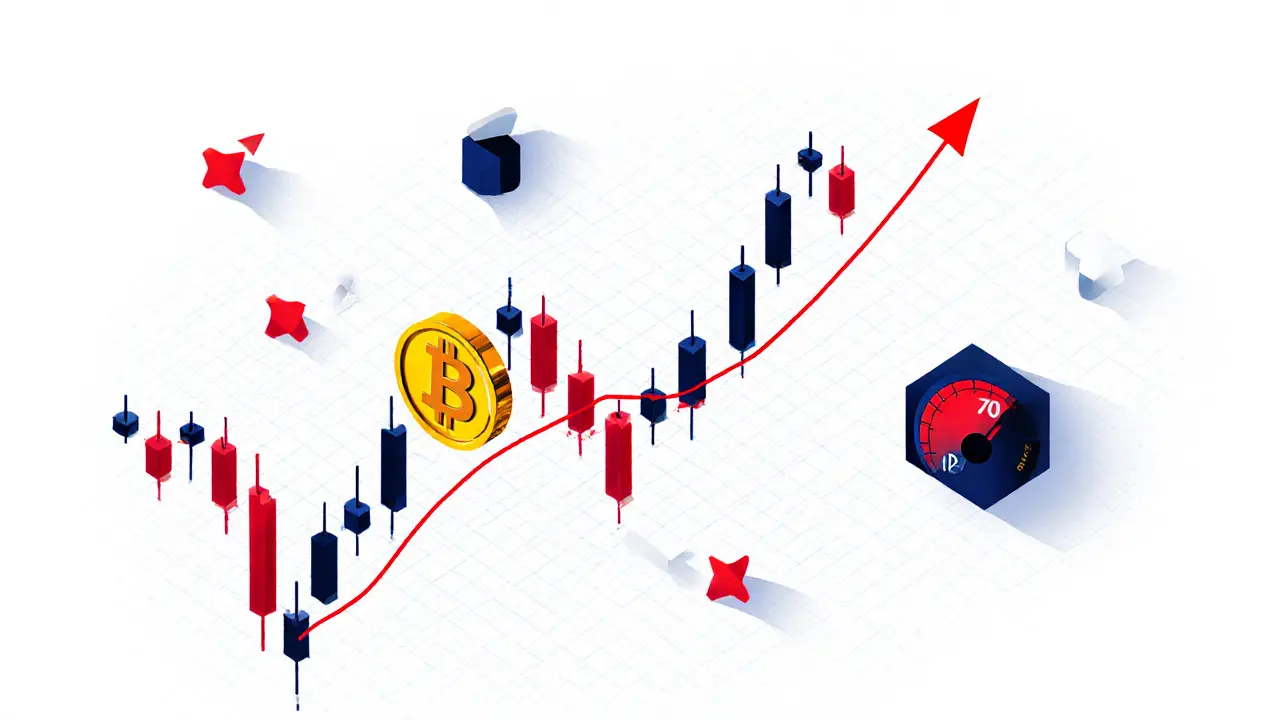
What Is Technical Analysis for Cryptocurrency? A Practical Guide for Traders
Technical analysis for cryptocurrency uses price charts and indicators to predict market movements. Learn how support/resistance, moving averages, RSI, and candlesticks help traders make decisions - and why combining them with volume and on-chain data is key.
learn more