Crypto Chart Patterns: How to Read Price Moves and Avoid Common Traps
When you look at a crypto chart pattern, a visual shape formed by price movements over time that traders use to predict future moves. Also known as technical patterns, it's not magic—it's history repeating itself in markets driven by fear, greed, and herd behavior. Whether you're new or have traded for years, these patterns show up on every major coin—from Bitcoin to memecoins—because human psychology doesn't change, even when the asset does.
These patterns don't work in isolation. They rely on support and resistance, price levels where buying or selling pressure historically stops or reverses movement. Also known as key price zones, they're the backbone of every reliable chart setup. A head and shoulders pattern means nothing if you don't know where the neckline (resistance) is. A triangle breakout fails if volume isn't there to back it up. That’s why traders who ignore context end up buying tops and selling bottoms. And yes, this is why so many people lose money chasing ‘guaranteed’ patterns they saw on TikTok.
Then there’s candlestick patterns, single or multi-candle formations that signal shifts in market sentiment, like doji, hammer, or engulfing bars. Also known as price action signals, they’re the language of short-term traders. A single red candle doesn’t mean a crash. But a series of long red candles after a big rally? That’s a warning. You don’t need fancy indicators. You just need to know what the candles are saying—and when they’re lying. Many fake breakouts look like real ones. That’s why volume, timing, and market sentiment (like fear and greed) matter more than the pattern itself.
What you’ll find below isn’t a list of ‘winning patterns.’ It’s a collection of real cases—some worked, some didn’t. You’ll see how a trader mistook a dead coin’s random bounce for a double bottom. How a Solana DEX’s token broke out on paper but vanished days later. How even the clearest ascending triangle failed because the team abandoned the project. These aren’t textbook examples. They’re messy, real, and full of lessons you won’t find in YouTube videos.
Chart patterns are tools—not crystal balls. They work best when you combine them with what’s happening in the real world: regulatory news, exchange listings, team activity, or even just a sudden drop in social media buzz. The posts here show you exactly that: how patterns play out (or collapse) when they meet reality. No fluff. No hype. Just what actually happened—and why.
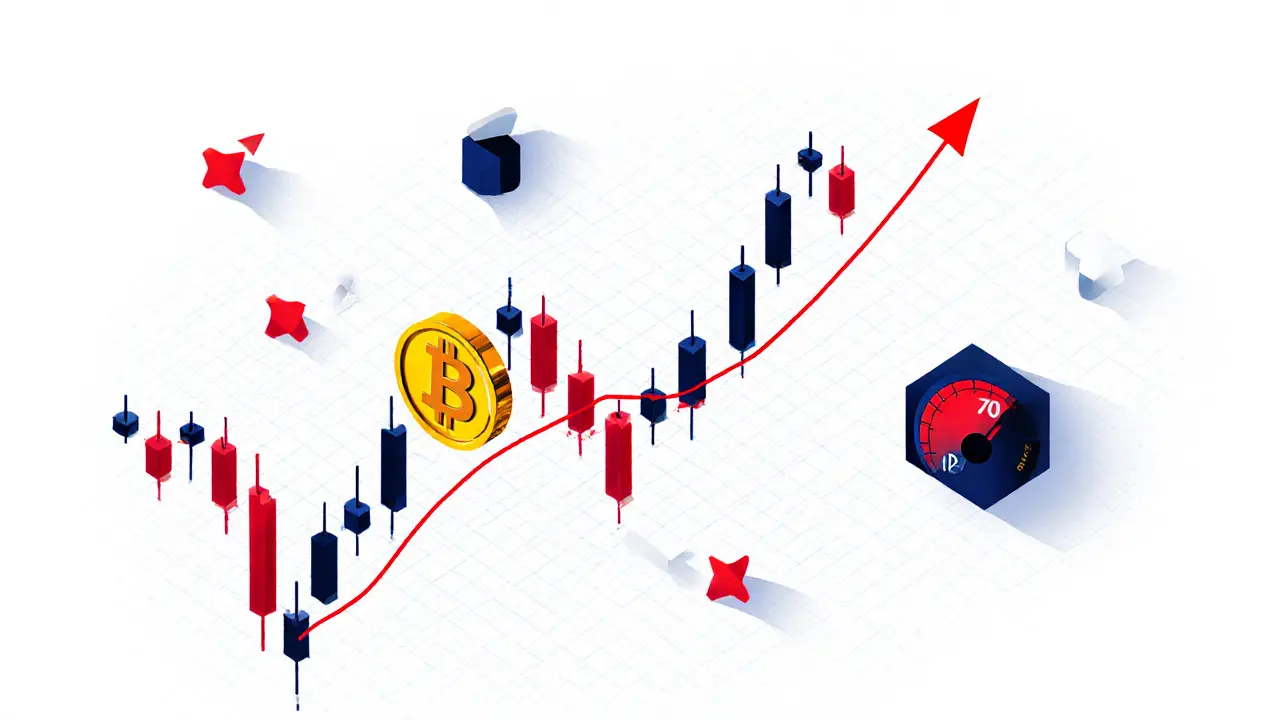
What Is Technical Analysis for Cryptocurrency? A Practical Guide for Traders
Technical analysis for cryptocurrency uses price charts and indicators to predict market movements. Learn how support/resistance, moving averages, RSI, and candlesticks help traders make decisions - and why combining them with volume and on-chain data is key.
learn more