
You put $10,000 into a liquidity pool because the yield looked juicy. Six months later, your token balance is up, but your dollar value is down. Why? You likely got caught in the mechanics of liquidity mining token emissions. These aren't just free money; they are a complex economic engine designed to bootstrap decentralized finance (DeFi) protocols by paying users for providing capital. But if you don't understand how these tokens are created, released, and diluted, you're gambling, not investing.
The Chicken-and-Egg Problem Solved by Emissions
Imagine launching a new exchange with zero traders. Nobody wants to trade there because there's no volume. No volume means no traders. This is the classic liquidity chicken-and-egg problem. Protocols like Compound solved this in June 2020 by distributing their COMP tokens to early users. Suddenly, people had a financial incentive to park their assets on the platform, even if the interest rates were low. This model exploded. By December 2025, Ethereum’s DeFi ecosystem alone had distributed over $12.7 billion in token emissions to liquidity providers, according to Token Terminal data.
The core idea is simple: pay users in governance or utility tokens to provide liquidity. This creates an initial user base and trading volume. Once that network effect kicks in, the protocol hopes the organic fees will sustain it without needing massive token payouts. But here’s the catch-those emissions create inflation. If a protocol prints too many tokens too fast, the price crashes, wiping out any gains from the yield.
How Emission Schedules Actually Work
Not all emissions are created equal. The way tokens are released determines whether a project survives or dies. Most modern protocols use smart contracts to release tokens at set intervals, but the curve matters immensely.
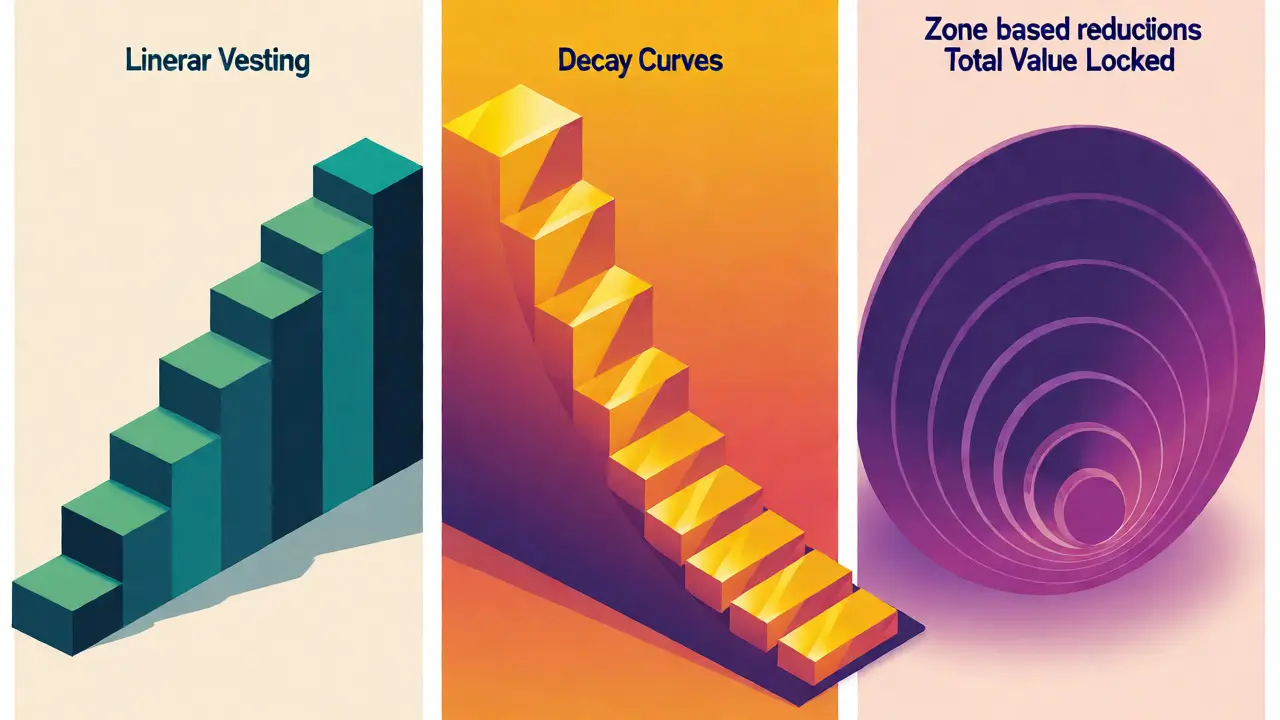
- Linear Vesting: Tokens unlock at a steady rate over time. Uniswap initially used a four-year vesting schedule for its UNI tokens. This prevents immediate dumping but can lead to slow adoption if rewards feel too distant.
- Decay Curves: Rewards start high and drop exponentially. SushiSwap famously halved its emissions every two weeks. This creates urgency for early adopters but punishes latecomers.
- Zone-Based Reductions: Newer models, like those seen in EarnPark, reduce emissions as total value locked (TVL) increases. As more people join, the reward per user drops, protecting the protocol from runaway inflation.
Current data shows that well-designed schedules achieve 70-85% retention of liquidity providers after the initial hype fades. Poorly structured ones see retention drop to 25-40%. The difference often lies in whether the emissions are tied to actual usage or just passive holding.
The Hidden Cost: Impermanent Loss vs. Yield
This is where most retail investors get burned. Liquidity mining yields often look impressive-sometimes hitting 1,000% APR during launch phases. But APR is calculated based on the current token price. If the token price drops by 50% due to inflationary pressure, your effective yield halves. Worse, you face impermanent loss. When the price of one asset in your pair moves significantly against the other, the automated market maker (AMM) rebalances your position. You end up with less of the appreciating asset and more of the depreciating one compared to simply holding them.
For stablecoin pairs, impermanent loss is minimal (5-15%). For volatile pairs like ETH/ALT, it can hit 20-50% during normal market swings. A Reddit thread titled "My $50k liquidity mining disaster" highlighted a user who earned high emission yields but lost 98.7% of their portfolio value when the MIR protocol collapsed in Q4 2024. High emissions attract "mercenary capital"-money that leaves the moment better yields appear elsewhere.
Evolution Beyond Simple Emissions: veTokenomics
Protocols realized that dumping emissions led to sell pressure. Enter vote-escrowed tokenomics, or veTokenomics. Pioneered by Curve Finance, this model requires users to lock their tokens to receive boosted rewards. The longer you lock, the higher your share of emissions. This aligns incentives: long-term holders get more power and profit, while short-term flippers get less.
| Feature | Standard Emissions | veTokenomics | Hybrid (Emission + Burn) |
|---|---|---|---|
| Sell Pressure | High (constant selling) | Low (locked supply) | Moderate (offset by burns) |
| Liquidity Retention | 25-40% | ~60% (32% higher than standard) | Variable |
| Complexity | Low | High (requires locking) | Medium |
| Example Protocol | Early SushiSwap | Curve, Frax | Ethereum (EIP-1559) |
Data from Delphi Digital’s Q1 2025 research shows that veTokenomics models have 32% higher liquidity retention and 27% more stable token prices compared to standard models. However, they require users to commit capital for months or years, reducing flexibility.

Risks: Death Spirals and Regulatory Scrutiny
When emissions exceed 10% monthly inflation, protocols risk entering a "death spiral." High inflation devalues the token, forcing the protocol to offer even higher yields to keep liquidity providers interested. This loop can accelerate until the token becomes worthless. Greeks.live documented several such cases in 2025.
Regulators are also watching. The SEC classified certain emission structures as unregistered securities offerings in its August 2024 case against YieldYield Protocol. In the EU, the MiCA framework now requires detailed disclosure of emission schedules in whitepapers. If a protocol doesn’t clearly explain how emissions are generated and distributed, it faces legal headwinds.
How to Evaluate an Emission Schedule
Before you deposit funds, check these three metrics. First, look at the revenue-to-emission ratio. Ideally, the protocol should generate enough real fees to cover at least half of its emissions. Currently, only 12% of top 100 protocols meet this threshold. Second, examine the vesting cliff. Are team and investor tokens unlocking soon? Large unlocks often cause price dips. Third, assess the utility. Do the emitted tokens grant governance rights or fee discounts? Tokens with no utility are pure inflation.
Institutional players like Fidelity allocate only 5-12% of portfolios to these positions, capping exposure at 15% APR. Retail investors often chase 75-150% APR, ignoring the underlying risks. Don’t be the exit liquidity for early insiders.
What is the main purpose of liquidity mining token emissions?
The primary purpose is to solve the liquidity chicken-and-egg problem by incentivizing users to provide capital to DeFi protocols. This bootstraps the network effect, allowing the protocol to function effectively before organic usage generates sufficient revenue.
Why do high APYs in liquidity mining often disappear quickly?
High APYs are typically driven by high token emissions relative to the total value locked. As more users join to capture these rewards, the emissions are spread across a larger pool, diluting individual returns. Additionally, if the token price drops due to inflation, the USD-denominated yield decreases rapidly.
What is the difference between linear vesting and decay curves in emissions?
Linear vesting releases tokens at a constant rate over a fixed period, providing predictable but potentially slow growth. Decay curves start with high emissions that decrease exponentially over time, creating strong early incentives but lower rewards for late adopters. Decay curves are better for bootstrapping, while linear vesting suits mature protocols.
How does veTokenomics differ from standard liquidity mining?
VeTokenomics requires users to lock their tokens for a set period to earn boosted rewards. This reduces circulating supply and sell pressure, leading to greater price stability and higher liquidity retention compared to standard models where tokens are freely tradable immediately upon receipt.
Is impermanent loss worse in high-emission protocols?
Yes, indirectly. High emissions often attract volatile assets seeking yield, increasing the likelihood of significant price divergence between paired tokens. This exacerbates impermanent loss. Furthermore, if the reward token itself crashes due to inflation, the net loss can far exceed the impermanent loss calculation alone.
Shruti Mala
September 28, 2026 AT 15:37OMG this is exactly what I needed to read today!! 🚀 The part about the "chicken-and-egg" problem really clicked for me because I was totally confused why new pools always have such crazy high APYs at first. It’s not free money, it’s basically a customer acquisition cost paid in tokens! 😤 I used to think if the APR was over 100% it meant the project was amazing, but now I realize that’s often just a red flag for massive inflation waiting to happen. You have to look at the actual revenue vs emissions ratio like you said. If the protocol isn't generating real fees, those emissions are just diluting our bags slowly but surely. I’m going to be way more careful with my next deposit and actually check the vesting schedules instead of just chasing the highest number on the dashboard. Thanks for breaking down the veTokenomics stuff too, locking up tokens feels scary but maybe it’s worth it for stability? 💎🙌
Aman Kumar Shah
September 29, 2026 AT 21:40Man, reading this takes me back to the wild west days of DeFi Summer when everyone thought they were geniuses because their portfolio went up 400% in a week... 😂 But seriously, the point about impermanent loss being the silent killer is so underrated. People see that juicy 200% APR and ignore the fact that if ETH drops against USDC, they’re getting wrecked by the AMM rebalancing mechanics before they even cash out their rewards. It’s like trying to fill a bucket with a hole in the bottom while someone keeps pouring water in from the top-the water (emissions) might look impressive, but the level (dollar value) doesn’t rise if the leak (IL + price dump) is faster than the inflow. And don’t get me started on the "mercenary capital" comment; it’s spot on. Liquidity providers aren’t investors, they’re tourists looking for the quickest buck, and the moment the decay curve hits, they bail faster than you can say "rug pull." We need to stop treating these protocols like savings accounts and start treating them like high-risk venture bets where the exit strategy matters more than the entry yield. Honestly, if you aren't comfortable losing 50% of your principal just to chase a temporary token pump, you shouldn't be touching volatile pairs in emission-heavy pools. Period.
Steve Parshall
September 30, 2026 AT 19:49This is a solid breakdown. 👍 I’ve been watching this space for a while and the shift towards veTokenomics is definitely the smart move for long-term sustainability. Curve proved that locking supply works, and seeing other protocols adopt similar models shows we’re maturing as an industry. The key takeaway for me is always checking the revenue-to-emission ratio. If a protocol prints more tokens than it earns in fees, it’s just running a Ponzi scheme with extra steps. Keep building!
Tiffany Kee
October 1, 2026 AT 03:17I appreciate how clearly you explained the risks without being too pessimistic. It’s easy to feel overwhelmed by all the jargon, but understanding that emissions are essentially paying for liquidity helps demystify the process. For anyone new to this, remember that high yields often come with hidden costs like impermanent loss or token dilution. It’s okay to take small positions while you learn the ropes. Stay safe out there! 🌱
Precious Ekwuribe
October 2, 2026 AT 09:20Finally someone who gets it. Most of these "experts" on Twitter are just shilling low-cap garbage with no utility. If the token has no governance rights or fee discounts, its literally just inflationary dust. The SEC case mentioned is crucial-regulators are finally catching up to the fact that most of these emissions are unregistered securities. Stop buying into hype cycles that ignore basic economic principles. If the revenue/emission ratio is under 1, you are subsidizing early insiders. Simple math. Don't let your FOMO override your IQ. 🧠
Mallika Sachdev
October 3, 2026 AT 06:21The distinction between passive holding and active usage in retention metrics is vital yet overlooked by retail investors who prioritize greed over diligence. Protocols that reward mere presence rather than genuine engagement inevitably suffer from mercenary capital flight leaving honest users with diluted assets and diminished returns. One must scrutinize the vesting cliffs meticulously because large unlocks by insiders create artificial sell pressure that masquerades as market volatility thereby trapping unsuspecting participants who fail to recognize the structural disadvantages embedded within the emission schedule itself.
Shawn Jayroe
October 4, 2026 AT 12:08Excellent analysis. To add to the discussion on evaluation metrics: when assessing the 'utility' aspect, consider whether the token grants access to exclusive features or higher-tier services. For instance, some protocols offer reduced trading fees for stakers, which creates a natural demand sink. Without such mechanisms, the token is purely speculative. Also, keep an eye on the total value locked trends relative to emission rates. A rising TVL with stable emissions indicates healthy organic growth, whereas rising TVL driven solely by increasing emissions suggests a fragile ecosystem dependent on constant incentive injection. Good luck with your investments!
Kaitlin Ruiz
October 6, 2026 AT 09:05Love this post!! 🔥 So many people forget that APR is calculated on current price, not future price. That’s why you see 1000% APR turn into negative returns overnight. Also, the table comparing standard vs veTokenomics is super helpful. I’ve been using Frax lately and the locking mechanism does make me feel more committed, even if it ties up my capital. Definitely recommend checking out Delphi Digital’s reports for deeper dives into these stats. 📊✨
sarah lucero baer
October 7, 2026 AT 14:53good points here. i think the regulatory angle is underrated though. if miCA forces better disclosure, we might see fewer scammy projects. also, impermanent loss is real but people panic too much about it. if you hold through the volatility, sometimes the yield makes up for it. depends on your risk tolerance i guess. stay balanced.
Christian Carneado
October 8, 2026 AT 11:52Thank you for sharing this insightful perspective. It is important to remember that liquidity mining is a tool, not a guarantee. As we navigate these complex economic structures, patience and due diligence remain our best allies. The evolution toward veTokenomics represents a positive step toward aligning incentives between protocol developers and users. Let us continue to educate ourselves and support sustainable practices within the DeFi community. Wishing everyone success in their financial journeys.
Mo Habib
October 10, 2026 AT 03:13WAIT WAIT WAIT. Are you saying the SEC is actually doing something?? 🤯 Because last time I checked, they were still pretending DeFi doesn't exist. This MiCA framework thing sounds like Europe is actually taking control while the US sleeps. But honestly, why do we trust any of these protocols? Who audits the smart contracts for the emission logic? Is it really transparent or just code that looks pretty? I feel like we're all just gambling with fancy words attached. Someone needs to expose the inner workings of these "revenue" claims because half of them look like circular funding schemes to me. Just saying. 🕵️♂️💸
Jennifer Moore
October 10, 2026 AT 08:09I completely agree with the sentiment regarding the complexity of these systems, and I believe that the average user is often left behind because the educational resources available are either too technical or too simplistic, failing to bridge the gap between theoretical economics and practical application. When we talk about impermanent loss, we often neglect the psychological impact it has on decision-making, causing users to sell at the worst possible times due to panic rather than rational analysis. Furthermore, the regulatory landscape is shifting rapidly, and while frameworks like MiCA provide clarity, they also impose compliance costs that may disproportionately affect smaller, innovative protocols, potentially stifling competition and leading to consolidation among larger entities that can afford legal teams. It is crucial for the community to advocate for transparent reporting standards that go beyond mere tokenomics charts and delve into actual cash flow statements, ensuring that investors are not misled by inflated metrics that do not reflect underlying business health. Ultimately, the sustainability of DeFi depends on its ability to demonstrate real-world utility and financial viability, rather than relying solely on speculative token appreciation driven by aggressive emission schedules.
Matthew Twin
October 10, 2026 AT 13:51Whoa, hold up!!! ✋🛑 This chart is GOLD. Seriously. The comparison between standard emissions and veTokenomics is the missing link most people miss. It’s not just about yield; it’s about supply shock management. When you lock tokens, you’re effectively creating scarcity, which supports price action. Standard emissions just flood the market. Think of it like printing money vs. burning it. One causes hyperinflation, the other creates value. And yeah, the "death spiral" concept is terrifyingly accurate. Once the confidence breaks, the run happens fast. Faster than you can blink. Protect your downside first, upside second. Always. 📉📈
Muyiwa Osibolu
October 11, 2026 AT 19:51The Western narrative conveniently ignores the geopolitical implications of these financial instruments. By classifying emissions as securities, the US is attempting to maintain dollar hegemony through regulatory capture. These protocols are not merely decentralized experiments; they are battlegrounds for monetary sovereignty. The data presented is skewed by survivorship bias, favoring successful Western-centric projects while ignoring systemic vulnerabilities inherent in centralized oracle dependencies. We must approach these figures with skepticism, recognizing that true decentralization remains elusive under current regulatory pressures.
Daniel Tremblay
October 13, 2026 AT 11:52Stop letting corporations gamify your savings. 🛑 Emissions are designed to extract value from retail investors, not empower them. The "chicken and egg" story is a myth sold to justify infinite dilution. Real ownership means voting power, not just receiving trash tokens. Wake up. 🧠💸
Ayodele Emmanuel
October 14, 2026 AT 01:19Nice writeup bro! 👊 Really helped me understand why my previous LP position got wrecked. I was chasing the 500% APR without checking the unlock schedule. Rookie mistake. Now I only look at protocols with clear burn mechanisms or ve-models. Much safer bet. Keep grinding! 🇳🇬🔥
Ashley Cooke
October 15, 2026 AT 04:28To expand on the evaluation criteria: it is also prudent to monitor the concentration of liquidity. If a significant portion of the pool is held by a few large wallets, the risk of sudden withdrawal events increases dramatically, regardless of the emission model. Diversification across multiple protocols with different emission curves can mitigate this specific type of idiosyncratic risk. Additionally, consider the correlation between the emitted token and the underlying asset pair; highly correlated assets may reduce impermanent loss but increase exposure to sector-specific downturns.
sai charan
October 16, 2026 AT 16:00Most of this is surface-level fluff. The real issue is MEV and sandwich attacks eating up the yield before it even hits your wallet. You calculate 20% APR, execute the trade, and lose 5% to gas and slippage plus another 3% to arbitrage bots. Then the token dumps 10%. Net result? Negative. The article assumes frictionless markets. They don't exist. Unless you're running your own node and optimizing execution, you're the liquidity for the pros. Sad truth. 📉
Gary Bryant
October 17, 2026 AT 21:04lol nobody reads past the first paragraph anyway. jargon overload much? "veTokenomics" "AMM rebalancing" "impermanent loss"... it's just crypto casino. if u want yield buy bonds. if u want degen play slots. middle ground is for suckers who think they can beat the algo. whatever. 🤷♂️